This is only the beginning of an idea. Really just me thinking aloud.
In my algebra 1 morning session at TMC [sidenote: I have a TMC reflection post in the works, but I'm still processing it all] we talked about linear functions, and the idea of functions and relationships in general. My group discussed that most of us were using Graphing Stories which I had a lot of fun with this year. In addition to this, @pwobyrne said that he uses graphs from Indexed which I'd never heard of before. I looked it up that night and was hooked. I stayed up way too late reading that night. Go check it out now if you haven't.
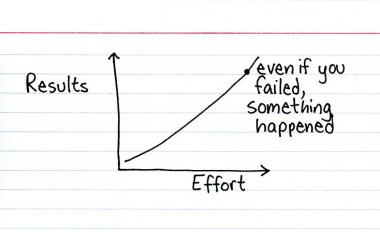
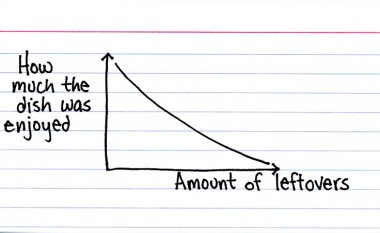
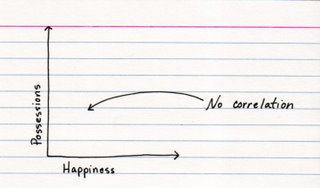
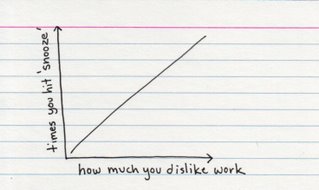
She just posts a little index card graph each day. These are just a few I like:
 |
| source |
 |
| source |
 |
| source |
 |
| source |
 |
| source |
So how could we use this??
I have a couple ideas floating around my head:
- An open-ended writing task. Just give the kids a graph and have them write about it. Write about what the graph means, why that might be, what it means, anything else that may come to mind. Get them interpreting the graph and get them writing. Really open ended though so that they can put down whatever they notice and wonder. Having them do this on index cards and hanging them up could be cute. Maybe have it like once a week? Indexed Mondays? That's not a catchy name at all...
- After they are comfortable with the idea, maybe give them one without the line drawn and have them decide and draw what the graph might look like. They could compare with each other and talk about why they are similar/different and what it means. If I did this I might not want to show them the one from the website because I think their opinions would all be valid (as long as they put some thought into it) and I wouldn't want them to think they got it "wrong."
- Maybe have them browse the website themselves and pick one/some out to talk about. Or maybe look for one they disagree with and have them explain why.
Any other ideas? I'd love to hear them. Let's discuss...


I love this idea. I am moving up to 8th grade and had never seen the graphing stories website. I am glad I read this post!
ReplyDeleteGreat website!!! Thanks for the link. I'm thinking out loud: I noticed each index card you posted is generalized--kind of like the "resolution" of graphing stories. I wonder if you could have students personalize it by drawing a picture or image which tells the story of the graph. Sort of like your first bullet point, but it is done visually (better visual image for a mobile display?).
ReplyDeleteOR, have students come in with various tasting foods, or doing activities they love or dread, take pictures of the student(s) with a facial expression, glue the pic on one side of the index card, the graph on the other.
As a quick warm-up you could present the graph without an x or y axis label and have the students guess the other. Or describe the intervals for a particular graph?
TFS! Looking forward to your recap of #TMC13.
ReplyDeleteI love the idea of using these graphs and just having the kids write and talk about them. It gets them comfortable with graphs, and the relationships they represent, before you add any numbers. Thanks for sharing!
ReplyDeleteThanks for sharing this - love this!
ReplyDelete--Lisa
Fabulous idea! Can't wait to try this.
ReplyDelete